Purpose
This script gathers ticker data on the tickers in the TickerList.csv file and calculates the following metrics:
- Simple moving averages
- RSI
- Exponential moving averages
- MACD
Then the tickers are filtered using the following user-defined parameters:
- MinPrice
- MaxPrice
- MinRSI
- MaxRSI
- MinVol
- MA1
- MA2
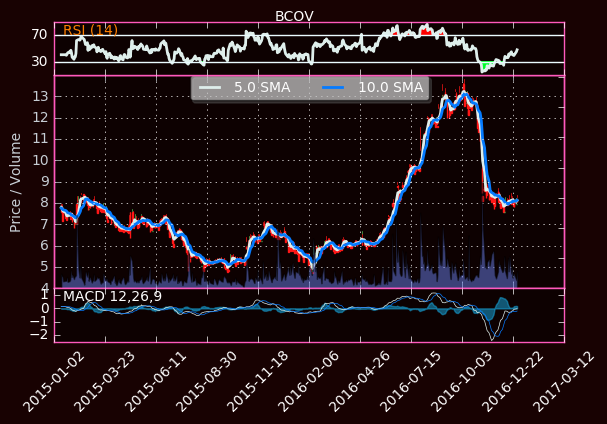
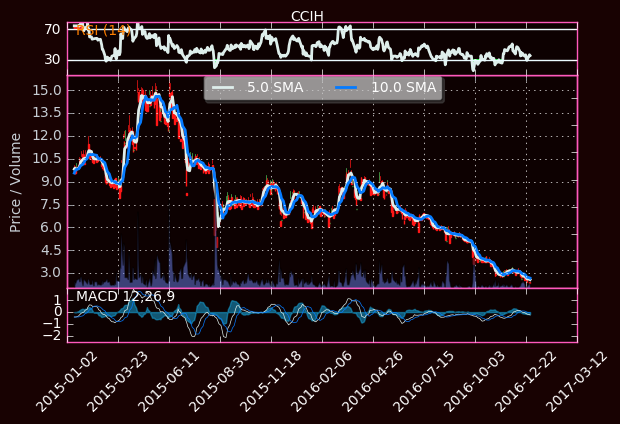
The technical charts of the tickers that meet the user-defined criteria are then displayed.
# Import libraries
import warnings
warnings.filterwarnings('ignore')
import matplotlib
import matplotlib.pyplot as plt
import matplotlib.ticker as mticker
import matplotlib.dates as mdates
from matplotlib.finance import candlestick_ohlc
matplotlib.rcParams.update({'font.size': 10})
import pylab
import numpy as np
import time
import datetime
import urllib.request
import http
# Define functions

#Define function to calculate Moving Averages
def movingAvg(data, range):
    weights = np.repeat(1.0, range)/range
    avg = np.convolve(data, weights, 'valid')
    return avg

#Define function to calculate RSI
def rsiCalc(data, n = 14):
    deltas = np.diff(data)
    seed = deltas[:n+1]
    up = seed[seed >= 0].sum()/n
    down = -seed[seed < 0].sum()/n
    rs = up/down
    rsi = np.zeros_like(data)
    rsi[:n] = 100. - 100. / (1. + rs)
    for i in range(n, len(data)):
        delta = deltas[i - 1]
        if delta > 0:
            upval = delta
            downval = 0.
        else:
            upval = 0.
            downval = -delta
        up = (up * (n-1) + upval) / n
        down = (down * (n-1) + downval) / n
        rs = up / down
        rsi[i] = 100. - 100. / (1. + rs)
    return rsi

#Define function to calculate Exponential Moving Average
def expMovingAvg(data, range):
    weights = np.exp(np.linspace(-1.,0.,range))
    weights /= weights.sum()
    avg = np.convolve(data, weights, mode = 'full')[:len(data)]
    avg[:range] = avg[range]
    return avg

#Define function to calculate MACD
def macdCalc(x, slow = 26, fast = 12):
    emaslow = expMovingAvg(x, slow)
    emafast = expMovingAvg(x, fast)
    return emaslow, emafast, emafast - emaslow
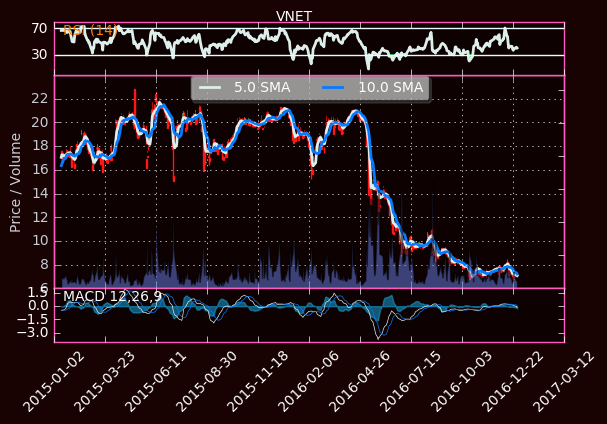
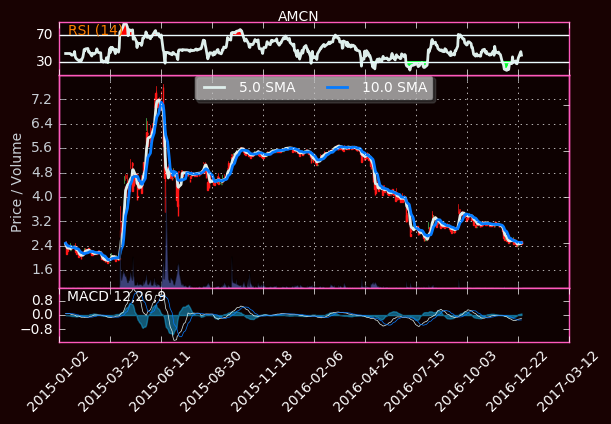
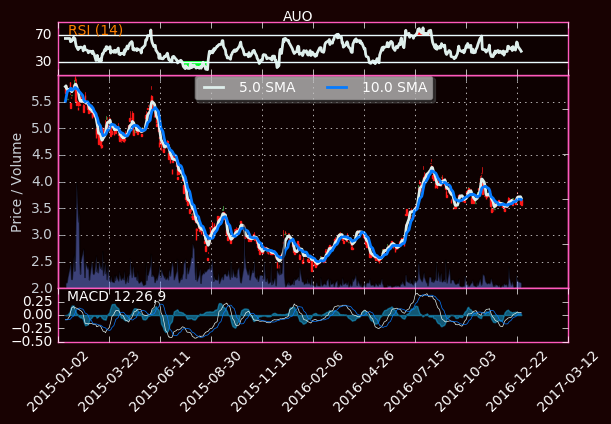
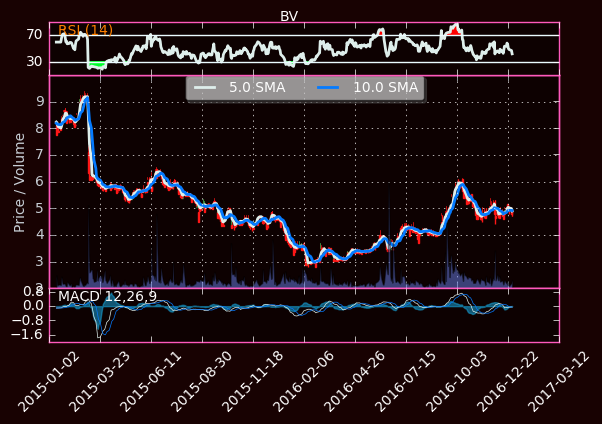
#Define function to generate graph
def generateGraph(ticker, MA1, MA2):

    #Download ticker data using Yahoo! Finance API
    apiURL = 'http://chartapi.finance.yahoo.com/instrument/1.0/'+ticker+'/chartdata;type=quote;range=2y/csv'

    #Create list that will store the ticker data
    dataList = []

    #Read and parse data
    fp = urllib.request.urlopen(apiURL).read()
    rawData = fp.decode("utf8")
    splitData = rawData.split('\n')
    for eachLine in splitData:
        #Use comma as the delimiter
        splitLine = eachLine.split(',')

        #Ignore header
        if len(splitLine) == 6:
            if 'values' not in eachLine:
                dataList.append(eachLine)

    #Use NumPy to load data
    date, closePrice, highPrice, lowPrice, openPrice, volume = np.loadtxt(dataList,delimiter = ',',unpack = True,
                                                                          converters = { 0: mdates.bytespdate2num('%Y%m%d')})

    #Create array to be plotted in Candlestick format
    i = 0
    j = len(date)
    candlestickData = []
    while i < j:
        oneDayData = date[i], openPrice[i], closePrice[i], highPrice[i], lowPrice[i], volume[i]
        candlestickData.append(oneDayData)
        i += 1

    #Calculate the moving averages
    avg1 = movingAvg(closePrice, MA1)
    avg2 = movingAvg(closePrice, MA2)

    #Leave out initial data for which moving averages are not available
    startingPoint = len(date[MA2-1:])

    #Make plot and define face color
    fig = plt.figure(facecolor = '#180202')

    #Make candlestick plot
    candlestickPlot = plt.subplot2grid((6,4), (1,0), rowspan = 4, colspan = 4, axisbg = '#0d0101')
    candlestick_ohlc(candlestickPlot, candlestickData[-startingPoint:], width = 1, colorup = '#53C156', colordown = '#ff1717')

    #Define labels for the moving averages
    Label1 = str(MA1) + ' SMA'
    Label2 = str(MA2) + ' SMA'

    #Plot the moving averages
    candlestickPlot.plot(date[-startingPoint:], avg1[-startingPoint:], '#deeeeb', label = Label1, linewidth = 2)
    candlestickPlot.plot(date[-startingPoint:], avg2[-startingPoint:], '#057bff', label = Label2, linewidth = 2)

    #Turn on grid
    candlestickPlot.grid(True, color = 'w')
    #Define max x-axis ticks
    candlestickPlot.xaxis.set_major_locator(mticker.MaxNLocator(10))
    #Format dates to be more readable
    candlestickPlot.xaxis.set_major_formatter(mdates.DateFormatter('%Y-%m-%d'))
    #Prune upper tick
    plt.gca().yaxis.set_major_locator(mticker.MaxNLocator(prune = 'upper'))
    #Set y-axis label color
    candlestickPlot.yaxis.label.set_color('#c8cfd6')
    #Set label colors
    candlestickPlot.tick_params(axis = 'x', colors = '#c8cfd6')
    candlestickPlot.tick_params(axis = 'y', colors = '#c8cfd6')
    plt.ylabel('Price / Volume')
    #Set graph border color
    candlestickPlot.spines['bottom'].set_color('#ff59bd')
    candlestickPlot.spines['top'].set_color('#ff59bd')
    candlestickPlot.spines['left'].set_color('#ff59bd')
    candlestickPlot.spines['right'].set_color('#ff59bd')

    #Make legend
    MALegend = plt.legend(loc = 9, ncol =2, prop = {'size': 10}, fancybox = True, borderaxespad = 0., shadow = True)
    MALegend.get_frame().set_alpha(0.5)
    legendText = pylab.gca().get_legend().get_texts()
    pylab.setp(legendText[0:5], color = 'w')

    #Add volume
    minVol = 0
    volPlot = candlestickPlot.twinx()
    volPlot.fill_between(date[-startingPoint:], minVol, volume[-startingPoint:], facecolor = '#6b81f0', alpha = 0.5)
    volPlot.axes.yaxis.set_ticklabels([])
    #Set border colors
    volPlot.spines['bottom'].set_color('#ff59bd')
    volPlot.spines['top'].set_color('#ff59bd')
    volPlot.spines['left'].set_color('#ff59bd')
    volPlot.spines['right'].set_color('#ff59bd')
    #Make sure volume bars do not go too high
    volPlot.set_ylim(0, 2*volume.max())
    #Set tick parameters
    volPlot.tick_params(axis = 'x', colors = 'w')
    volPlot.tick_params(axis = 'y', colors = 'w')

    #Make RSI plot
    rsiPlot = plt.subplot2grid((6,4), (0,0), sharex = candlestickPlot, rowspan = 1, colspan = 4, axisbg = '#0d0101')
    #Calculate RSI
    rsi = rsiCalc(closePrice)
    posCol = '#386d13'
    negCol = '#8f2020'
    rsiPlot.plot(date[-startingPoint:],rsi[-startingPoint:], '#deeeeb', linewidth = 2)
    #Make horizontal lines at ris = 70 and rsi = 30 to represent overbought and oversold points
    rsiPlot.axhline(70, color = '#eafbff')
    rsiPlot.axhline(30, color = '#eafbff')
    #Fill overbought and oversold conditions
    rsiPlot.fill_between(date[-startingPoint:],rsi[-startingPoint:],70, where = rsi[-startingPoint:] >= 70, facecolor = '#ff0000', edgecolor = '#ff0000')
    rsiPlot.fill_between(date[-startingPoint:],rsi[-startingPoint:],30, where = rsi[-startingPoint:] < 30, facecolor = '#00ff2b', edgecolor = '#00ff2b')
    #Set title of graph
    rsiPlot.text(0.018, 0.98, 'RSI (14)', va = 'top', color = '#FF8000', transform = rsiPlot.transAxes)
    #Set border color
    rsiPlot.spines['bottom'].set_color('#ff59bd')
    rsiPlot.spines['top'].set_color('#ff59bd')
    rsiPlot.spines['left'].set_color('#ff59bd')
    rsiPlot.spines['right'].set_color('#ff59bd')


    #Set tick parameters
    rsiPlot.tick_params(axis = 'y', colors = 'w')
    rsiPlot.tick_params(axis = 'x', colors = 'w')
    rsiPlot.set_yticks([30, 70])
    rsiPlot.yaxis.label.set_color('w')

    #Make MACD plot
    macdPlot = plt.subplot2grid((6,4), (5,0), sharex = candlestickPlot, rowspan = 1, colspan = 4, axisbg = '#0d0101')

    #Define MACD parameters
    slow = 26
    fast = 12
    ema = 9

    #Calculate MACD and Exponential Moving Average
    emaslow, emafast, macd = macdCalc(closePrice)
    ema9 = expMovingAvg(macd, ema)

    #Plot data
    macdPlot.plot(date[-startingPoint:], macd[-startingPoint:], color = '#deeeeb', lw = 0.5)
    macdPlot.plot(date[-startingPoint:], ema9[-startingPoint:], color = '#057bff', lw = 0.5)
    macdPlot.fill_between(date[-startingPoint:], macd[-startingPoint:] - ema9[-startingPoint:], 0, alpha = 0.5, facecolor = '#17aee7', edgecolor = '#17aee7')

    #Add chart title
    macdPlot.text(0.017, 0.98, 'MACD 12,26,9', va = 'top', color = 'w', transform = macdPlot.transAxes)
    #Set border color
    macdPlot.spines['bottom'].set_color('#ff59bd')
    macdPlot.spines['top'].set_color('#ff59bd')
    macdPlot.spines['left'].set_color('#ff59bd')
    macdPlot.spines['right'].set_color('#ff59bd')
    #Define tick parameters
    macdPlot.tick_params(axis = 'x', colors = 'w')
    macdPlot.tick_params(axis = 'y', colors = 'w')
    macdPlot.yaxis.set_major_locator(mticker.MaxNLocator(nbins = 5, prune = 'upper'))

    #Set bottom graph x labels as 45 degrees
    for label in macdPlot.xaxis.get_ticklabels():
        label.set_rotation(45)

    #Set ticker as title of all graphs
    plt.suptitle(ticker, color = 'w')

    #Hide x labels of other plots
    plt.setp(candlestickPlot.get_xticklabels(), visible = False)
    plt.setp(rsiPlot.get_xticklabels(), visible = False)

    #Adjust the spacing of the graphs
    plt.subplots_adjust(left = .1, bottom = .15, right = .95, top = .95, wspace = .20, hspace = 0)

    #Show plot
    plt.show()
# Define paramaters
MinPrice = 1
MaxPrice = 10
MinRSI = 0
MaxRSI = 50
MinVol = 100000
MA1 = 5.0
MA2 = 10.0

#Open and read ticker file
TickerReader = open('TickerList.csv','r').read()
splitTickers = TickerReader.split('\n')

for ticker in splitTickers:
    #Download ticker data using Yahoo! Finance API
    apiURL = 'http://chartapi.finance.yahoo.com/instrument/1.0/'+ticker+'/chartdata;type=quote;range=2y/csv'

    #Create list that will store the ticker data
    dataList = []

    #Read and parse data
    try:
        fp = urllib.request.urlopen(apiURL).read()
        rawData = fp.decode("utf8")

        splitData = rawData.split('\n')
        for eachLine in splitData:
            #Use comma as the delimiter
            splitLine = eachLine.split(',')

            #Ignore header
            if len(splitLine) == 6:
                if 'values' not in eachLine:
                    dataList.append(eachLine)

        if len(dataList) > 200:
            #Use NumPy to load data
            date, closePrice, highPrice, lowPrice, openPrice, volume = np.loadtxt(dataList,delimiter = ',',unpack = True,
                                                                                  converters = { 0: mdates.bytespdate2num('%Y%m%d')})
            #Calculate RSI and average volume
            RSI = rsiCalc(closePrice)
            avgVol = sum(volume) / len(volume)

            #Run filter and generate graph
            if closePrice[-1] > float(MinPrice) and closePrice[-1] < float(MaxPrice) and RSI[-1] > float(MinRSI) and RSI[-1] < float(MaxRSI) and float(avgVol) > float(MinVol):
                generateGraph(ticker, MA1, MA2)

    except:
        pass