The goals / steps of this project are the following:
- Compute the camera calibration matrix and distortion coefficients given a set of chessboard images.
- Apply a distortion correction to raw images.
- Use color transforms, gradients, etc., to create a thresholded binary image.
- Apply a perspective transform to rectify binary image ("birds-eye view").
- Detect lane pixels and fit to find the lane boundary.
- Determine the curvature of the lane and vehicle position with respect to center.
- Warp the detected lane boundaries back onto the original image.
- Output visual display of the lane boundaries and numerical estimation of lane curvature and vehicle position.
Description of how I computed the camera matrix and distortion coefficients.
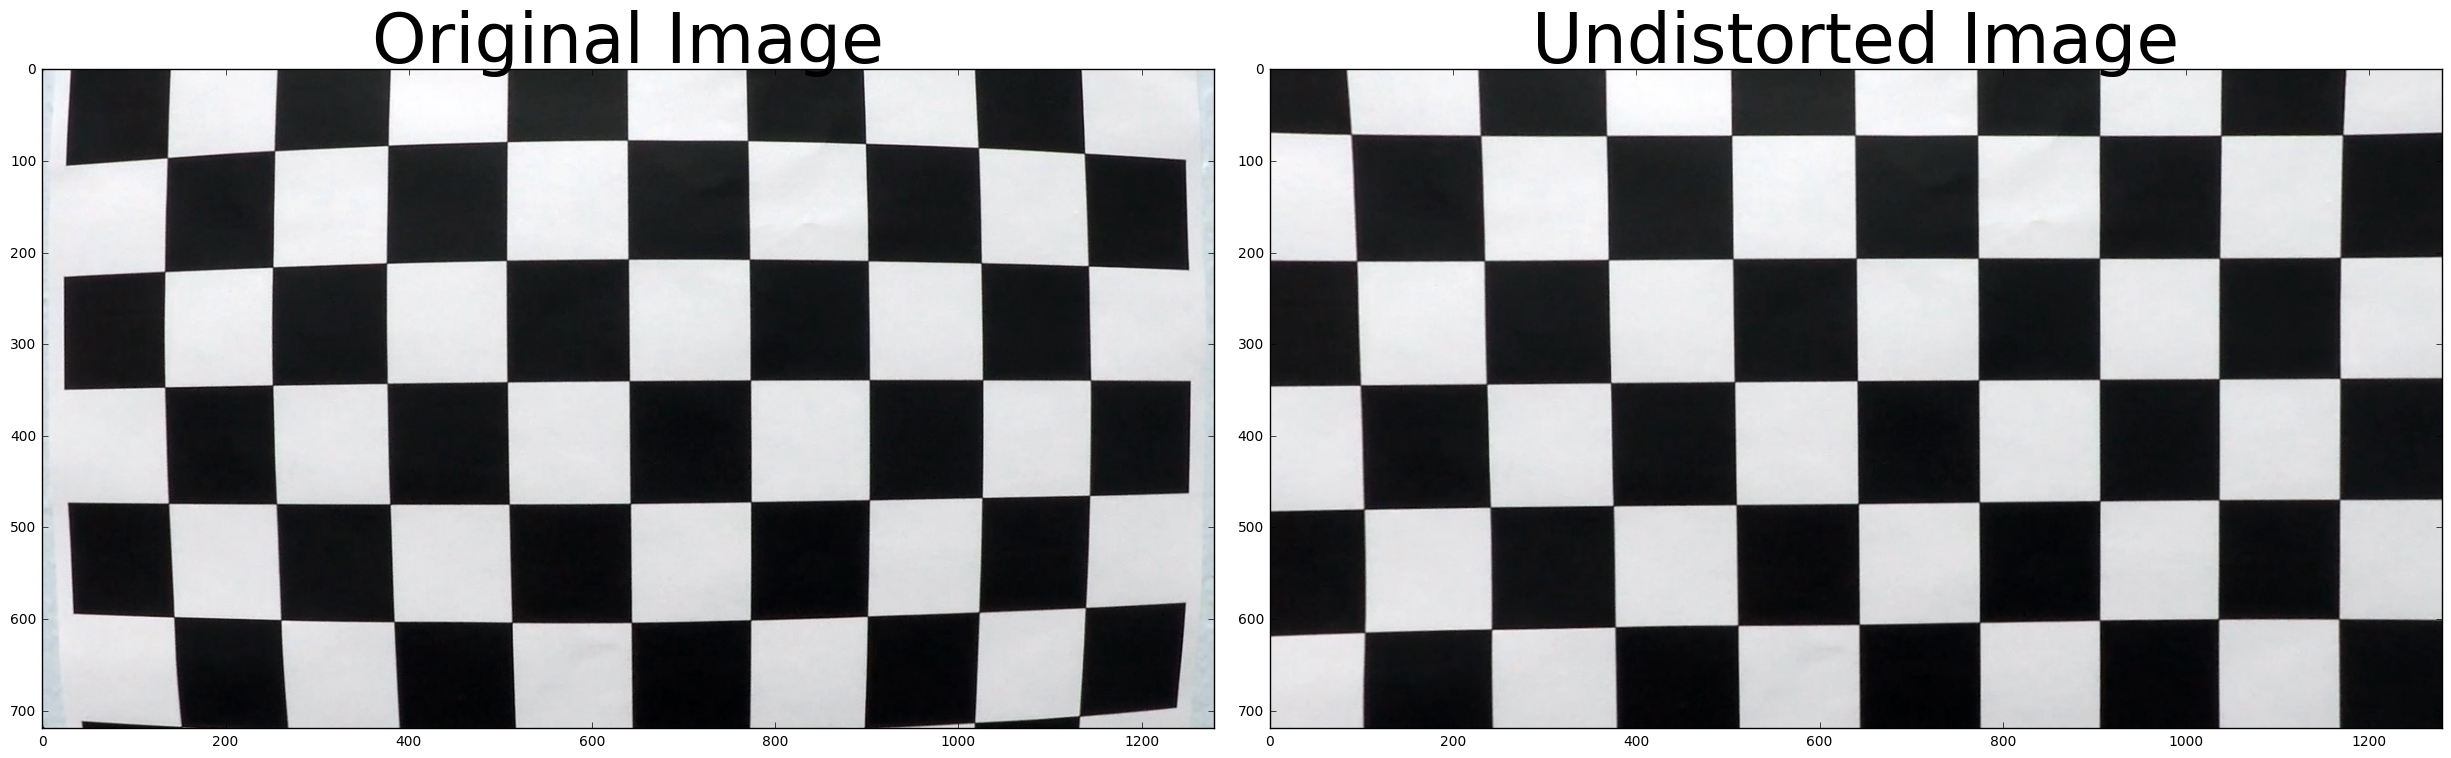
I started by preparing "object points", which will be the (x, y, z) coordinates of the chessboard corners in the world. Here I am assuming the chessboard is fixed on the (x, y) plane at z=0, such that the object points are the same for each calibration image. Thus, objp is just a replicated array of coordinates, and objpoints will be appended with a copy of it every time I successfully detect all chessboard corners in a test image. imgpoints will be appended with the (x, y) pixel position of each of the corners in the image plane with each successful chessboard detection.
I then used the output objpoints and imgpoints to compute the camera calibration and distortion coefficients using the cv2.calibrateCamera() function. I applied this distortion correction to the test image using the cv2.undistort() function.
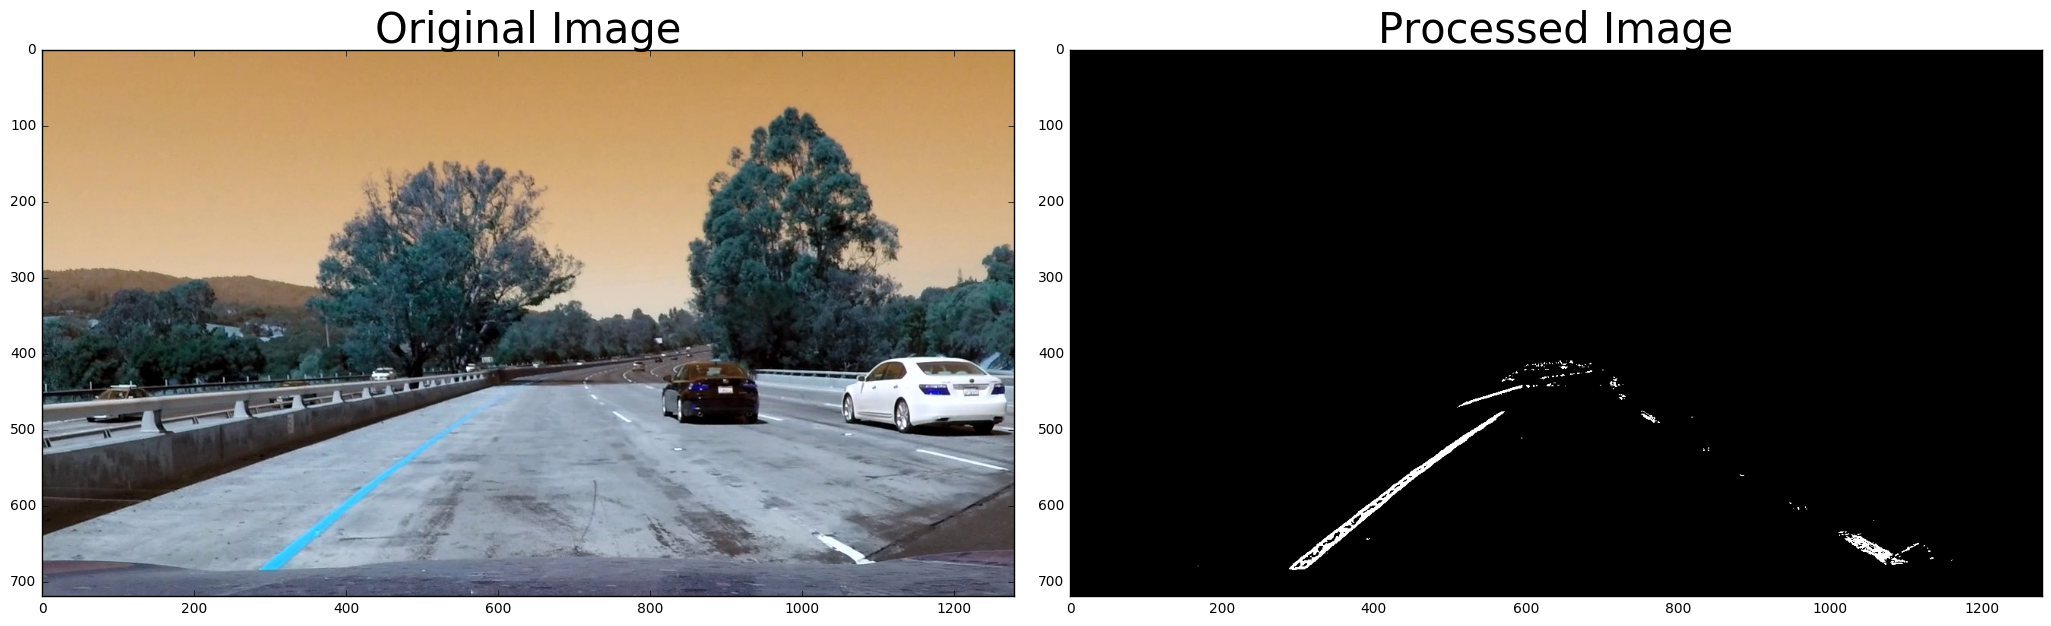
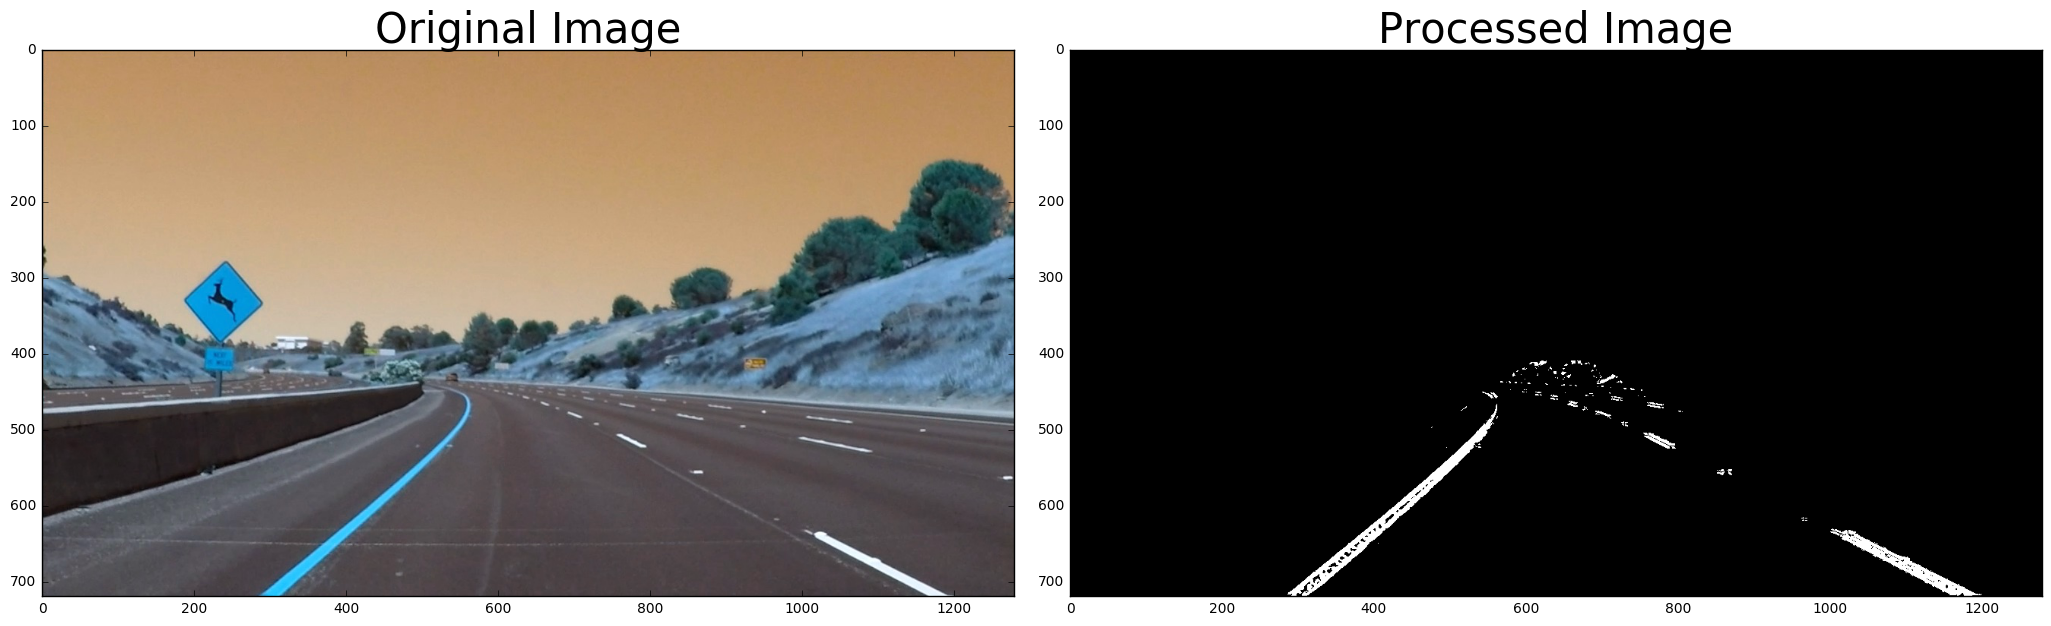
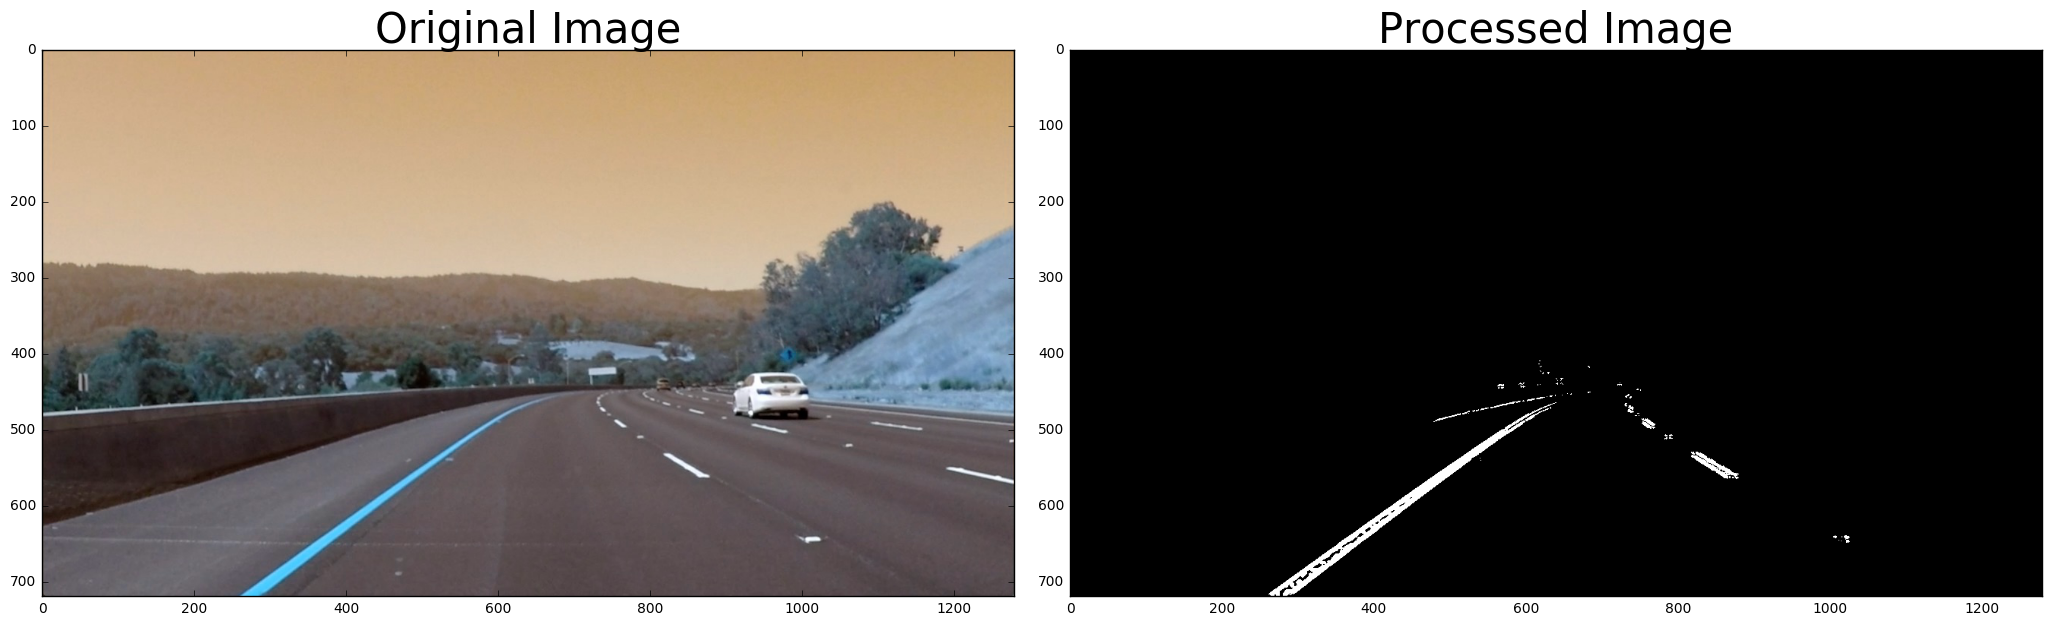
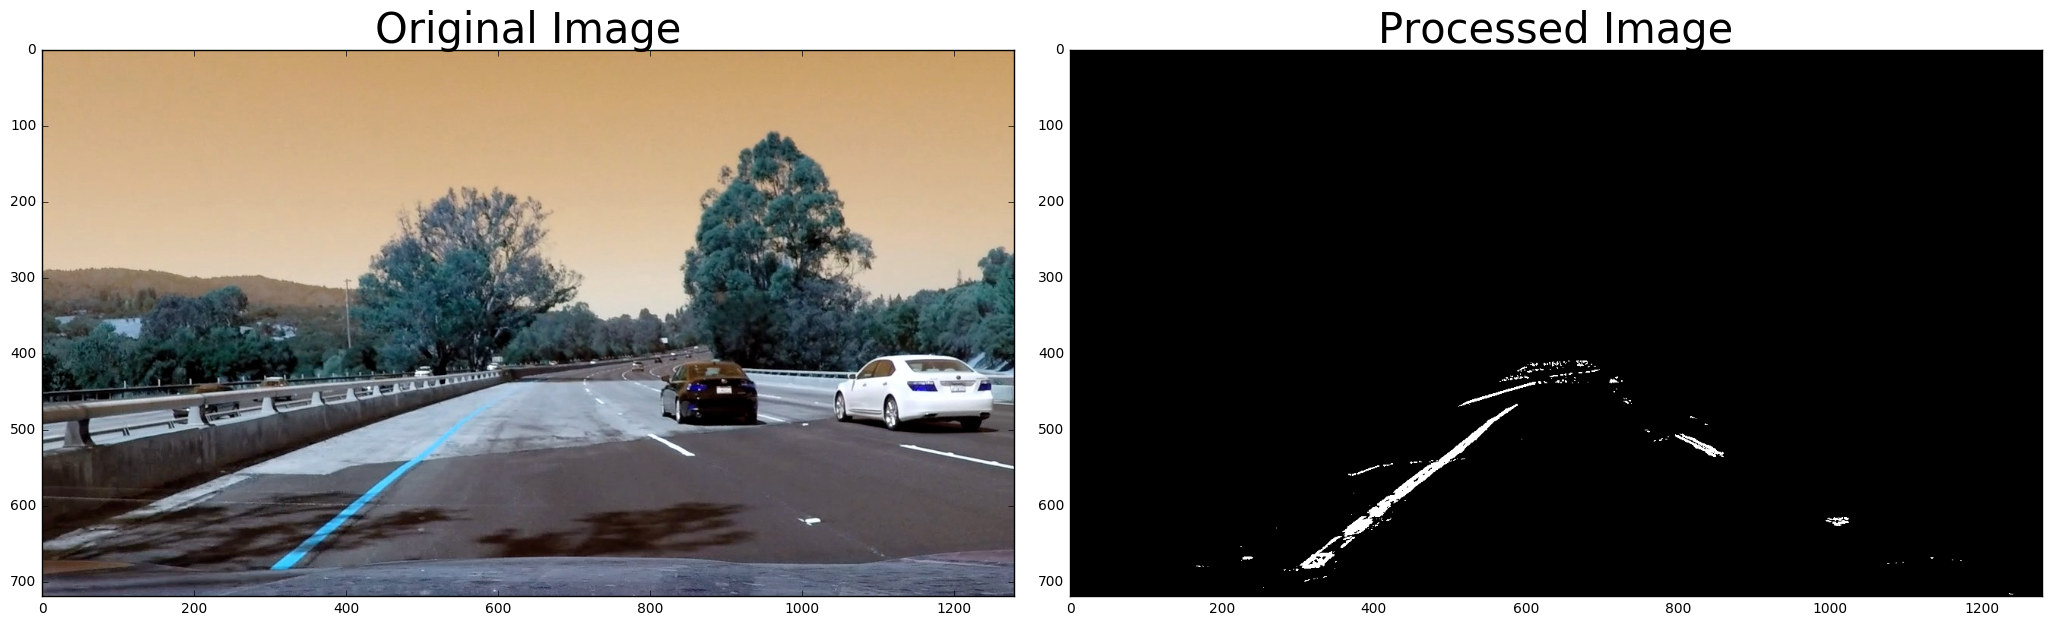
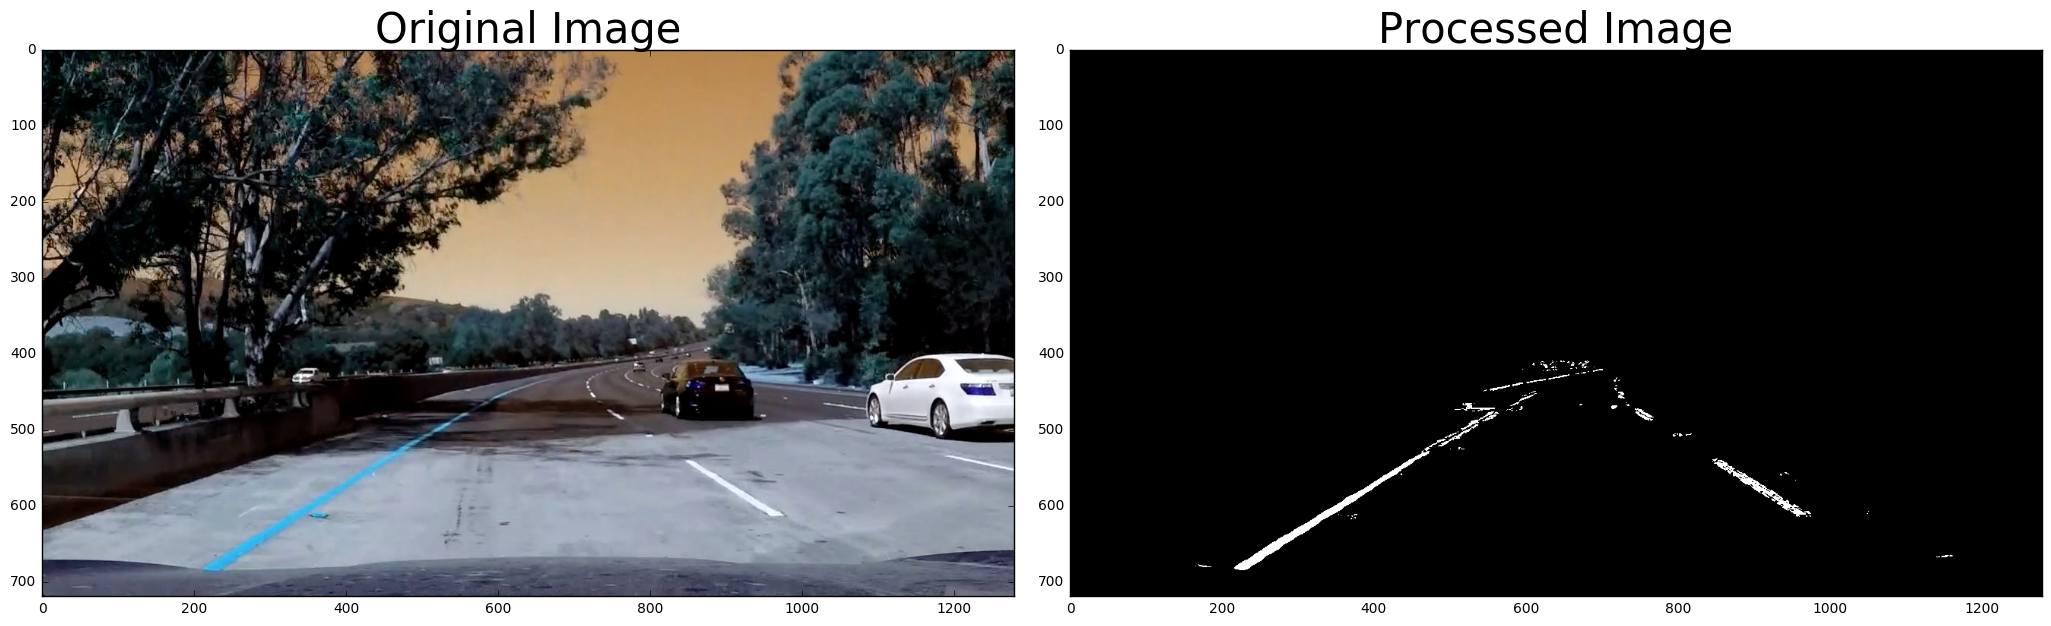
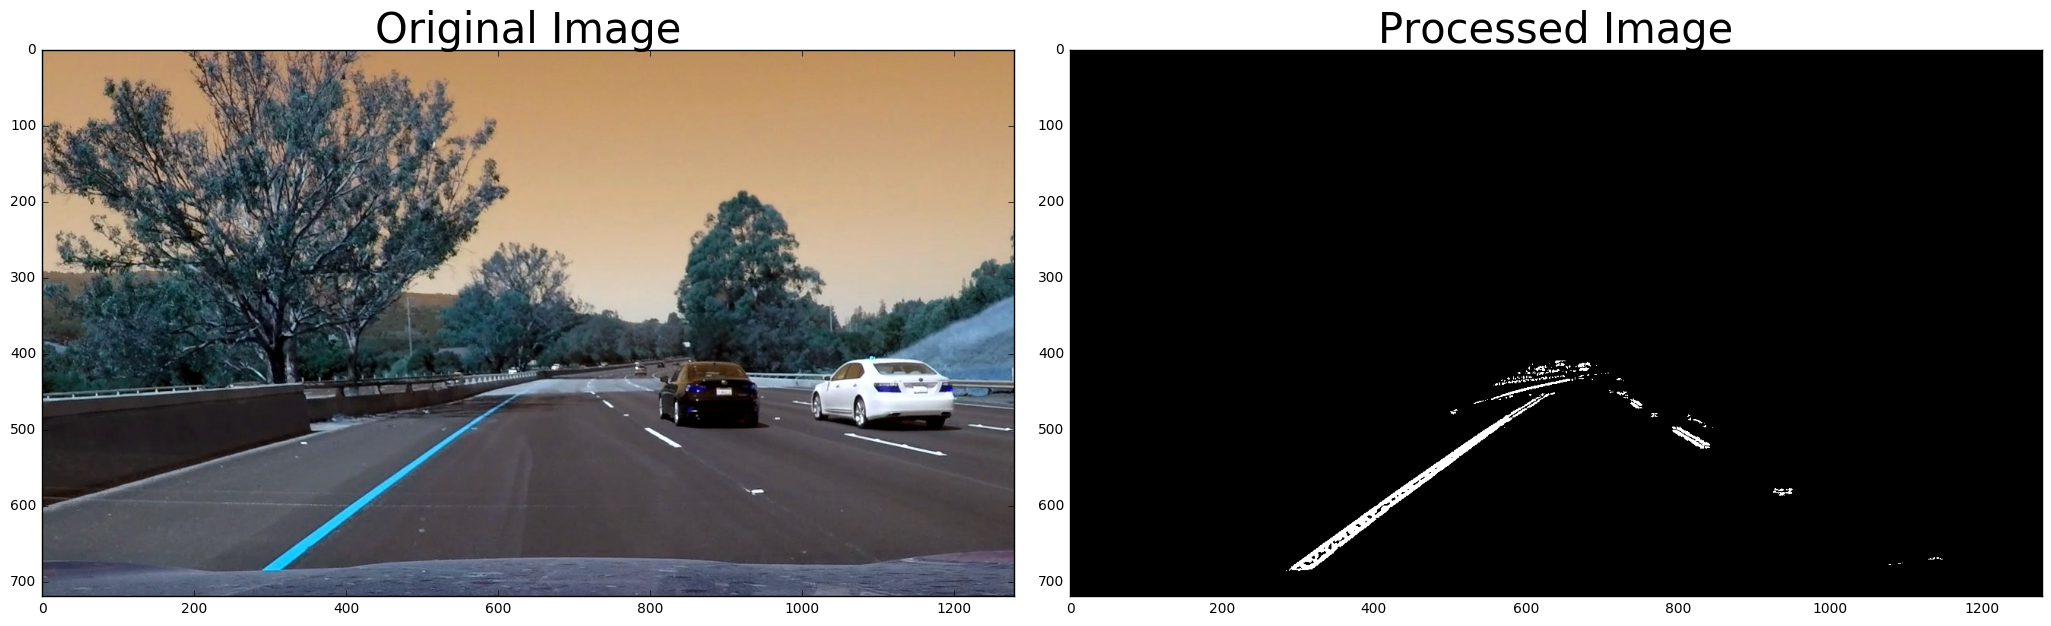
Description of how I used color transforms, gradients or other methods to create a thresholded binary image.
I used a combination of color and gradient thresholds to generate a binary image.
Description of how I performed a perspective transform.
The unwarp_image() function takes as inputs an image (img), as well as source (src) and destination (dst) points. I chose to hardcode the source and destination points in the following manner:
src = np.float32([[580,460],[710,460],[1150,720],[150,720]])
dst = np.float32([[offset1, offset3],
                  [img_size[0]-offset1, offset3],
                  [img_size[0]-offset1, img_size[1]-offset2],
                  [offset1, img_size[1]-offset2]])
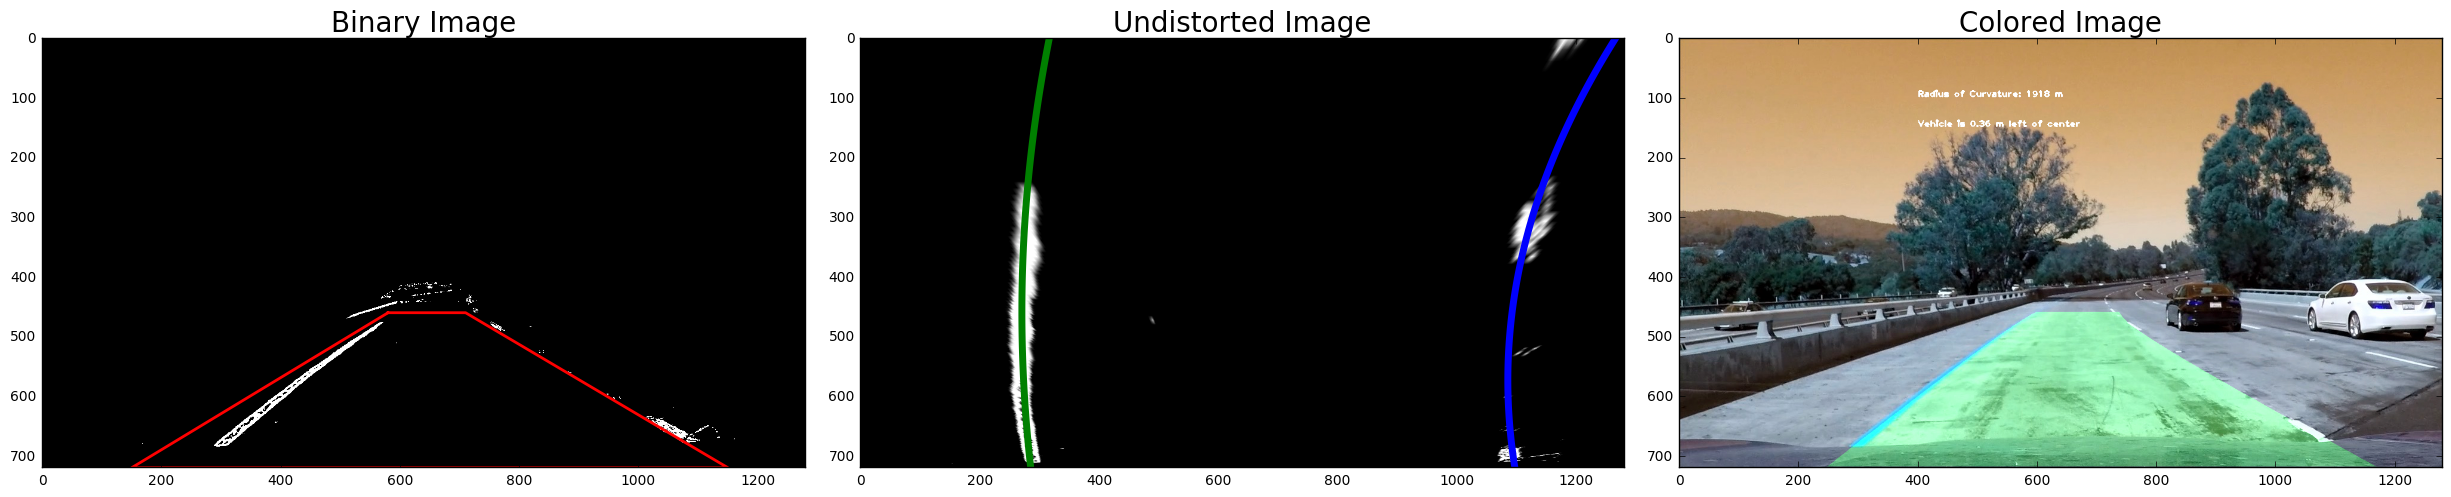
Description of how I identified lane-line pixels and fit their positions with a polynomial.
To find the position of the lanes, a histogram is generated from which I get a pair of peaks that represents the lanes. Then I do a sanity check that makes sure that those are indeed the lanes that I'm looking for. When my lanes are established, I use then go ahead and fit the pixels with a polynomal.
Description of how I calculated the radius of curvature of the lane and the position of the vehicle with respect to center.
This was done by first converting pixles into meters. The converstion coefficients were determined using the US Government requirements for the lane width and dashed line distance. Then I fitted a polynomial for each lane and determined the center. The polynomial derivatives are then calculated to get the curvature.
Brief discussion on any problems / issues I faced in my implementation of this project. Where will my pipeline likely fail? What could I do to make it more robust?
One of issues that I had with the implementation was tuning the hyperparameters to covert the image to binary. If this process was not done correctly, the pipeline did not do a good job at fitting the curve. If there is one place that the pipeless would fail, this would be it. If the lane pixels are not determined correctly, the fitted curve would be off. In order to make it more robust, I can implement a more stringent sanity check and put in place fail checks to correct for the mistakes.
Link to my final video output.
Here's a link to my video result
Camera Calibration
# Import libraries
import glob
import numpy as np
import cv2
import matplotlib.pyplot as plt
import matplotlib.image as mpimg
%matplotlib inline
from scipy import signal
import math

# Define path to calibration and test files
fnames = glob.glob('./camera_cal/calibration*.jpg')
show_img = './camera_cal/calibration{}.jpg'
test_fname = './camera_cal/calibration1.jpg'
fnames.remove(test_fname)

# Define number of corners
nx = 9
ny = 6

# Initialize object points
objpoints = np.zeros((nx * ny, 3), np.float32)
objpoints[:,:2] = np.mgrid[0:nx, 0:ny].T.reshape(-1,2)

imgpoints_vec = []
objpoints_vec = []

# Loop through all calibration images
for fname in fnames:
    # Read image
    img = cv2.imread(fname)

    # Convert images to greyscale
    gray = cv2.cvtColor(img, cv2.COLOR_BGR2GRAY)

    # Find the chessboard corners
    ret, corners = cv2.findChessboardCorners(gray, (nx, ny), None)

    # If found, draw corners
    if ret == True:
        imgpoints_vec.append(corners)
        objpoints_vec.append(objpoints)

        # Draw and display the corners
        if fname == show_img:
            img_corners = cv2.drawChessboardCorners(img, (nx, ny), corners, ret)
            plt.imshow(img_corners)

# Test on test image
test_img = cv2.imread(test_fname)
ret, mtx, dist, rvecs, tvecs = cv2.calibrateCamera(objpoints_vec, imgpoints_vec, test_img.shape[0:2],None,None)
undistorted = cv2.undistort(test_img, mtx, dist, None, mtx)

f, (ax1, ax2) = plt.subplots(1, 2, figsize=(24, 9))
f.tight_layout()
ax1.imshow(test_img)
ax1.set_title('Original Image', fontsize=50)
ax2.imshow(undistorted)
ax2.set_title('Undistorted Image', fontsize=50)
plt.subplots_adjust(left=0., right=1, top=0.9, bottom=0.)
Define Functions for Pipeline
def region_of_interest(img, vertices):
    """
    Applies an image mask.

    Only keeps the region of the image defined by the polygon
    formed from `vertices`. The rest of the image is set to black.
    """
    # Defining a blank mask to start with
    mask = np.zeros_like(img)

    # Defining a 3 channel or 1 channel color to fill the mask with depending on the input image
    if len(img.shape) > 2:
        channel_count = img.shape[2]  # i.e. 3 or 4 depending on your image
        ignore_mask_color = (255,) * channel_count
    else:
        ignore_mask_color = 255

    # Filling pixels inside the polygon defined by "vertices" with the fill color
    cv2.fillPoly(mask, vertices, ignore_mask_color)

    # Returning the image only where mask pixels are nonzero
    masked_image = cv2.bitwise_and(img, mask)
    return masked_image

# Function to apply Sobel
def abs_sobel_thresh(gray, orient='x', sobel_kernel=3, thresh=(0, 255)):
    # Take the derivative in x
    if orient == 'x':
        sobel = cv2.Sobel(gray, cv2.CV_64F, 1, 0)
    else:
        sobel = cv2.Sobel(gray, cv2.CV_64F, 0, 1)

    # Absolute x derivative to accentuate lines away from horizontal
    abs_sobel = np.absolute(sobel)
    scaled_sobel = np.uint8(255*abs_sobel/np.max(abs_sobel))

    # Threshold gradient
    sxbinary = np.zeros_like(scaled_sobel)
    sxbinary[(scaled_sobel >= thresh[0]) & (scaled_sobel <= thresh[1])] = 1
    return sxbinary

# Function to compute the magnitude of the gradient
def mag_thresh(gray, sobel_kernel=3, mag_thresh=(0, 255)):
    # Take both Sobel x and y gradients
    sobelx = cv2.Sobel(gray, cv2.CV_64F, 1, 0, ksize=sobel_kernel)
    sobely = cv2.Sobel(gray, cv2.CV_64F, 0, 1, ksize=sobel_kernel)
    # Calculate the gradient magnitude
    gradmag = np.sqrt(sobelx**2 + sobely**2)
    # Rescale
    scaled_gradmag = np.uint8(255*gradmag/np.max(gradmag))
    # Create a binary image of ones where threshold is met, zeros otherwise
    binary_output = np.zeros_like(scaled_gradmag)
    binary_output[(scaled_gradmag >= mag_thresh[0]) & (scaled_gradmag <= mag_thresh[1])] = 1

    # Return the binary image
    return binary_output

# Function to threshold an image for a given range and Sobel kernel
def dir_threshold(gray, sobel_kernel=3, thresh=(0, np.pi/2)):
    # Calculate the x and y gradients
    sobelx = cv2.Sobel(gray, cv2.CV_64F, 1, 0, ksize=sobel_kernel)
    sobely = cv2.Sobel(gray, cv2.CV_64F, 0, 1, ksize=sobel_kernel)
    # Take the absolute value of the gradient direction,
    # apply a threshold, and create a binary image result
    absgraddir = np.arctan2(np.absolute(sobely), np.absolute(sobelx))
    binary_output =  np.zeros_like(absgraddir)
    binary_output[(absgraddir >= thresh[0]) & (absgraddir <= thresh[1])] = 1

    # Return the binary image
    return binary_output
Create Pipeline
# Process image
def pipeline(img):
    # Apply Gaussian Blur
    kernel_size = 5
    img = cv2.GaussianBlur(img, (kernel_size, kernel_size), 0)
    # Convert to binary image
    hls = cv2.cvtColor(img, cv2.COLOR_RGB2HLS)
    S = hls[:,:,2]
    # Convert to grayscale
    gray = cv2.cvtColor(img, cv2.COLOR_RGB2GRAY)
    # Define Sobel kernel size
    ksize = 7
    # Apply each of the thresholding functions
    gradx = abs_sobel_thresh(gray, orient='x', sobel_kernel=ksize, thresh=(10, 250))
    grady = abs_sobel_thresh(gray, orient='y', sobel_kernel=ksize, thresh=(60, 255))
    mag_binary = mag_thresh(gray, sobel_kernel=ksize, mag_thresh=(40, 255))
    dir_binary = dir_threshold(gray, sobel_kernel=ksize, thresh=(0.65, 1.05))
    # Combine thresholding information
    combined = np.zeros_like(dir_binary)
    combined[((gradx == 1) & (grady == 1)) | ((mag_binary == 1) & (dir_binary == 1))] = 1
    # Apply threshold to color channel
    s_binary = np.zeros_like(combined)
    s_binary[(S > 160) & (S < 255)] = 1
    # Convert to binary images
    color_binary = np.zeros_like(combined)
    color_binary[(s_binary > 0) | (combined > 0)] = 1
    # Define vertices for marked area
    left_b = (100, img.shape[0])
    right_b = (img.shape[1]-20, img.shape[0])
    apex1 = (610, 410)
    apex2 = (680, 410)
    inner_left_b = (310, img.shape[0])
    inner_right_b = (1150, img.shape[0])
    inner_apex1 = (700,480)
    inner_apex2 = (650,480)
    vertices = np.array([[left_b, apex1, apex2, right_b, inner_right_b, \
                          inner_apex1, inner_apex2, inner_left_b]], dtype=np.int32)
    # Select region of interest
    color_binary = region_of_interest(color_binary, vertices)
    return color_binary

for i in range(1,7):
    fname = './test_images/test{}.jpg'.format(i)
    img = cv2.imread(fname)
    processed_img = pipeline(img)

    # Plot the result
    f, (ax1, ax2) = plt.subplots(1, 2, figsize=(20, 10))
    f.tight_layout()

    ax1.imshow(img)
    ax1.set_title('Original Image', fontsize=30)

    ax2.imshow(processed_img, cmap='gray')
    ax2.set_title('Processed Image', fontsize=30)

    plt.subplots_adjust(left=0., right=1, top=0.9, bottom=0.)
Define Line Class
# Define a class to receive the characteristics of each line detection
class Line():
    def __init__(self):
        # was the line detected in the last iteration?
        self.detected = False
        # x values of the last n fits of the line
        self.recent_xfitted = []
        #average x values of the fitted line over the last n iterations
        self.bestx = None
        #polynomial coefficients averaged over the last n iterations
        self.best_fit = None
        #polynomial coefficients for the most recent fit
        self.current_fit = [np.array([False])]
        #radius of curvature of the line in some units
        self.radius_of_curvature = None
        #distance in meters of vehicle center from the line
        self.line_base_pos = None
        #difference in fit coefficients between last and new fits
        self.diffs = np.array([0,0,0], dtype='float')
        #x values for detected line pixels
        self.allx = None
        #y values for detected line pixels
        self.ally = None
        #x values in windows
        self.windows = np.ones((3,12))*-1
Define Functions for Finding Lanes
# Define area of interest
area_of_interest = [[580,460],[710,460],[1150,720],[150,720]]

# Define function to unwarp image
def unwarp_image(img, nx, ny, mtx, dist):
    # Remove distortion from image
    undistorted_img = cv2.undistort(img, mtx, dist, None, mtx)
    # Choose offsets from image corners
    offset1 = 200
    offset2 = 0
    offset3 = 0
    # Get image shape
    img_size = (gray.shape[1], gray.shape[0])
    # Get source and destination points
    src = np.float32([[580,460],[710,460],[1150,720],[150,720]])
    dst = np.float32([[offset1, offset3],
                      [img_size[0]-offset1, offset3],
                      [img_size[0]-offset1, img_size[1]-offset2],
                      [offset1, img_size[1]-offset2]])

    # Given src and dst points, calculate the perspective transform matrix
    M = cv2.getPerspectiveTransform(src, dst)
    M_inv = cv2.getPerspectiveTransform(dst, src)
    # Get warped image
    warped = cv2.warpPerspective(undistorted_img, M, img_size)

    return warped, M, M_inv


# Define function to fit curve to lane
def get_curvature(yvals, fitx):
    # y-value location of radius of curvature
    y_eval = np.max(yvals)
    # Define conversions in x and y from pixels space to meters
    ym_per_pix = 30/720 # meters per pixel in y dimension
    xm_per_pix = 3.7/700 # meteres per pixel in x dimension
    fit_cr = np.polyfit(yvals*ym_per_pix, fitx*xm_per_pix, 2)
    curverad = ((1 + (2*fit_cr[0]*y_eval + fit_cr[1])**2)**1.5) \
                                 /np.absolute(2*fit_cr[0])
    return curverad

# Define function to get position
def get_position(img,pts):
    # Find position of car from center
    image_shape = img.shape
    position = image_shape[1]/2
    left  = np.min(pts[(pts[:,1] < position) & (pts[:,0] > 700)][:,1])
    right = np.max(pts[(pts[:,1] > position) & (pts[:,0] > 700)][:,1])
    center = (left + right)/2
    # Define conversions in x and y from pixels space to meters
    xm_per_pix = 3.7/700 # meteres per pixel in x dimension
    return (position - center)*xm_per_pix

# Define function to find nearest point from array
def get_nearest(array,value):
    if len(array) > 0:
        idx = (np.abs(array-value)).argmin()
        return array[idx]

# Find the historgram from image and get max
def get_peaks(img, ytop, ybottom, xleft, xright):

    histogram = np.sum(img[ytop:ybottom,:], axis=0)
    # Get max
    if len(histogram[int(xleft):int(xright)])>0:
        return np.argmax(histogram[int(xleft):int(xright)]) + xleft
    else:
        return (xleft + xright) / 2

# Define function for sanity check
def sanity_check(lane, curverad, fitx, fit):
    # If lane is detected
    if lane.detected:
        if abs(curverad / lane.radius_of_curvature - 1) < .6:
            lane.detected = True
            lane.current_fit = fit
            lane.allx = fitx
            lane.bestx = np.mean(fitx)
            lane.radius_of_curvature = curverad
            lane.current_fit = fit
        # Else use the previous values
        else:
            lane.detected = False
            fitx = lane.allx
    # If lane not detected and no curvature defined
    else:
        if lane.radius_of_curvature:
            if abs(curverad / lane.radius_of_curvature - 1) < 1:
                lane.detected = True
                lane.current_fit = fit
                lane.allx = fitx
                lane.bestx = np.mean(fitx)
                lane.radius_of_curvature = curverad
                lane.current_fit = fit
            else:
                lane.detected = False
                fitx = lane.allx
        # If curvature defined
        else:
            lane.detected = True
            lane.current_fit = fit
            lane.allx = fitx
            lane.bestx = np.mean(fitx)
            lane.radius_of_curvature = curverad
    return fitx

# Sanity check for the direction
def sanity_check_direction(right, right_pre, right_pre_pre):
    # Pass if correct direction
    if abs((right-right_pre) / (right_pre-right_pre_pre) - 1) < .2:
        return right
    # Else use the previous values
    else:
        return right_pre + (right_pre - right_pre_pre)

# Define function to find lines
def get_lanes(n, img, x_window, lanes, left_x, left_y, right_x, right_y, segment_ind):
    point1 = np.zeros((n+1,2))
    point1[0] = [300, 1100]
    point1[1] = [300, 1100]
    # Assign left and right values
    left, right = (300, 1100)
    # Assign center
    center = 700
    # Assign previous center
    center_pre = center
    # Assign direction
    direction = 0
    for i in range(0, n-1):
        # Set range
        y_top = 720-720/n*(i+1)
        y_bottom = 720-720/n*i
        # If left and right lanes detected
        if (left_lane.detected==False) and (right_lane.detected==False):
            # Get histogram
            left  = get_peaks(img, y_top, y_bottom, point1[i+1,0]-200, point1[i+1,0]+200)
            right = get_peaks(img, y_top, y_bottom, point1[i+1,1]-200, point1[i+1,1]+200)
            # Set direction
            left  = sanity_check_direction(left, point1[i+1,0], point1[i,0])
            right = sanity_check_direction(right, point1[i+1,1], point1[i,1])
            # Set center
            center_pre = center
            center = (left + right)/2
            direction = center - center_pre
        # If both lanes detected
        else:
            left  = left_lane.windows[segment_ind, i]
            right = right_lane.windows[segment_ind, i]
        # Double check distance between lanes
        if abs(left-right) > 600:
            # Add coordinates to left lane arrays
            left_lane_array = lanes[(lanes[:,1]>=left-x_window) & (lanes[:,1]<left+x_window) &
                                 (lanes[:,0]<=y_bottom) & (lanes[:,0]>=y_top)]
            left_x += left_lane_array[:,1].flatten().tolist()
            left_y += left_lane_array[:,0].flatten().tolist()
            if not math.isnan(np.mean(left_lane_array[:,1])):
                left_lane.windows[segment_ind, i] = np.mean(left_lane_array[:,1])
                point1[i+2,0] = np.mean(left_lane_array[:,1])
            else:
                point1[i+2,0] = point1[i+1,0] + direction
                left_lane.windows[segment_ind, i] = point1[i+2,0]
            # Append coordinates to the right lane arrays
            right_lane_array = lanes[(lanes[:,1]>=right-x_window) & (lanes[:,1]<right+x_window) &
                                  (lanes[:,0]<y_bottom) & (lanes[:,0]>=y_top)]
            right_x += right_lane_array[:,1].flatten().tolist()
            right_y += right_lane_array[:,0].flatten().tolist()
            if not math.isnan(np.mean(right_lane_array[:,1])):
                right_lane.windows[segment_ind, i] = np.mean(right_lane_array[:,1])
                point1[i+2,1] = np.mean(right_lane_array[:,1])
            else:
                point1[i+2,1] = point1[i+1,1] + direction
                right_lane.windows[segment_ind, i] = point1[i+2,1]
    return left_x, left_y, right_x, right_y

def fit_lanes(img):
    # Define y values for plotting
    yvals = np.linspace(0, 100, num=101)*7.2
    # Get coordinates from image
    lanes = np.argwhere(img)
    # Coordinates for left lane
    left_x = []
    left_y = []
    # Coordinates for right lane
    right_x = []
    right_y = []
    # Initialize curve
    curve = 0
    # Assign left and right as None
    left = None
    right = None
    # Find lanes
    left_x, left_y, right_x, right_y = get_lanes(4, img, 25, lanes, \
                                    left_x, left_y, right_x, right_y, 0)
    left_x, left_y, right_x, right_y = get_lanes(6, img, 50, lanes, \
                     left_x, left_y, right_x, right_y, 1)
    left_x, left_y, right_x, right_y = get_lanes(8, img, 75, lanes, \
                     left_x, left_y, right_x, right_y, 2)

    # Get coefficients of polynomials
    left_fit = np.polyfit(left_y, left_x, 2)
    left_fitx = left_fit[0]*yvals**2 + left_fit[1]*yvals + left_fit[2]
    right_fit = np.polyfit(right_y, right_x, 2)
    right_fitx = right_fit[0]*yvals**2 + right_fit[1]*yvals + right_fit[2]
    # Find curvatures
    left_curverad  = get_curvature(yvals, left_fitx)
    right_curverad = get_curvature(yvals, right_fitx)
    # Do sanity checks
    left_fitx  = sanity_check(left_lane, left_curverad, left_fitx, left_fit)
    right_fitx = sanity_check(right_lane, right_curverad, right_fitx, right_fit)

    return yvals, left_fitx, right_fitx, left_x, left_y, right_x, right_y, left_curverad

# Define function to draw polynomial on an image
def draw_poly(img, warped, yvals, left_fitx, right_fitx,
              left_x, left_y, right_x, right_y, Minv, curvature):
    # Create an image to draw the lines on
    warp_zero = np.zeros_like(warped).astype(np.uint8)
    color_warp = np.dstack((warp_zero, warp_zero, warp_zero))
    # Recast the x and y points into usable format for cv2.fillPoly()
    pts_left = np.array([np.transpose(np.vstack([left_fitx, yvals]))])
    pts_right = np.array([np.flipud(np.transpose(np.vstack([right_fitx, yvals])))])
    pts = np.hstack((pts_left, pts_right))
    # Draw the lane onto the warped blank image
    cv2.fillPoly(color_warp, np.int_([pts]), (0, 255, 0))
    # Warp the blank back to original image space using inverse perspective matrix (Minv)
    newwarp = cv2.warpPerspective(color_warp, Minv, (img.shape[1], img.shape[0]))
    # Combine the result with the original image
    result = cv2.addWeighted(img, 1, newwarp, 0.3, 0)
    # Put text on an image
    font = cv2.FONT_HERSHEY_PLAIN
    text = "Radius of Curvature: {} m".format(int(curvature))
    cv2.putText(result,text,(400,100), font, 1,(255,255,255),2)
    # Find the position of the car
    pts = np.argwhere(newwarp[:,:,1])
    position = get_position(img,pts)
    if position < 0:
        text = "Vehicle is {:.2f} m left of center".format(-position)
    else:
        text = "Vehicle is {:.2f} m right of center".format(position)
    cv2.putText(result,text,(400,150), font, 1,(255,255,255),2)
    return result
Define Function to Process Image
def process_image(image):
    # Put image through pipline
    img = pipeline(image)
    # Warp image to make lanes parallel to each other
    birds_eye, perspective_M, perspective_Minv = unwarp_image(img, nx, ny, mtx, dist)
    # Find the lines
    a, b, c, lx, ly, rx, ry, curvature = fit_lanes(birds_eye)
    # Return original image with colored region
    return draw_poly(image, birds_eye, a, b, c, lx, ly, rx, ry, perspective_Minv, curvature)
Draw Images
# Hide warnings
import warnings
warnings.filterwarnings('ignore')
# Used to plot lines on images
x_values = [area_of_interest[0][0],area_of_interest[1][0],area_of_interest[2][0],area_of_interest[3][0],area_of_interest[0][0]]
y_values = [area_of_interest[0][1],area_of_interest[1][1],area_of_interest[2][1],area_of_interest[3][1],area_of_interest[0][1]]
# Loop through test images
for i in range(1,7):
# Initialize lines for left and right
left_lane = Line()
right_lane = Line()
# Load image
fname = 'test_images/test{}.jpg'.format(i)
img_raw = cv2.imread(fname)
# Apply pipeline to the image to create binary image
img = pipeline(img_raw)
# Unwrap the image
birds_eye, perspective_M, perspective_Minv = unwarp_image(img, nx, ny, mtx, dist)
# Set Subplots
f, (ax1, ax2, ax3) = plt.subplots(1, 3, figsize=(24, 9))
f.tight_layout()
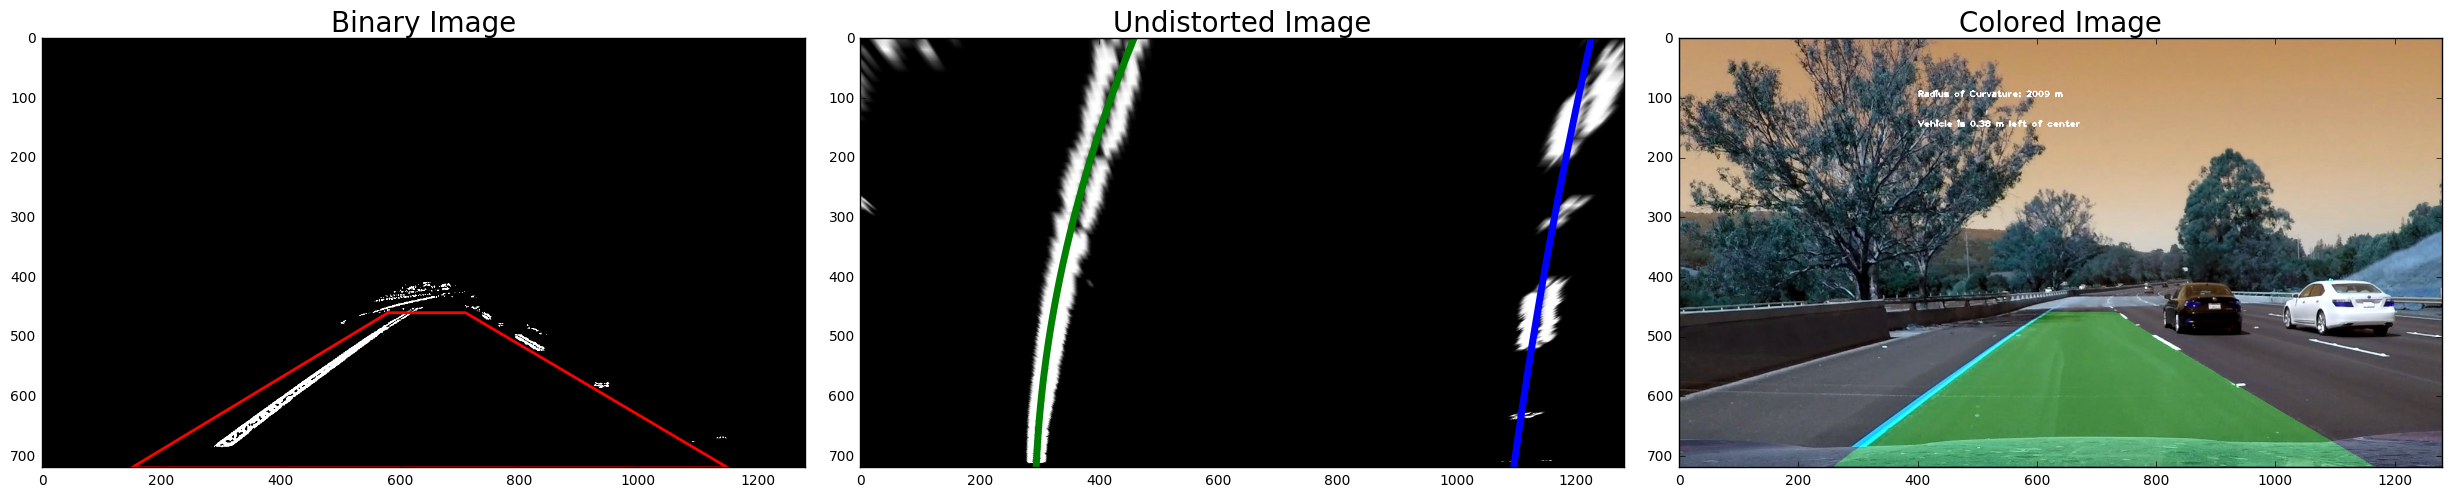
# Show image
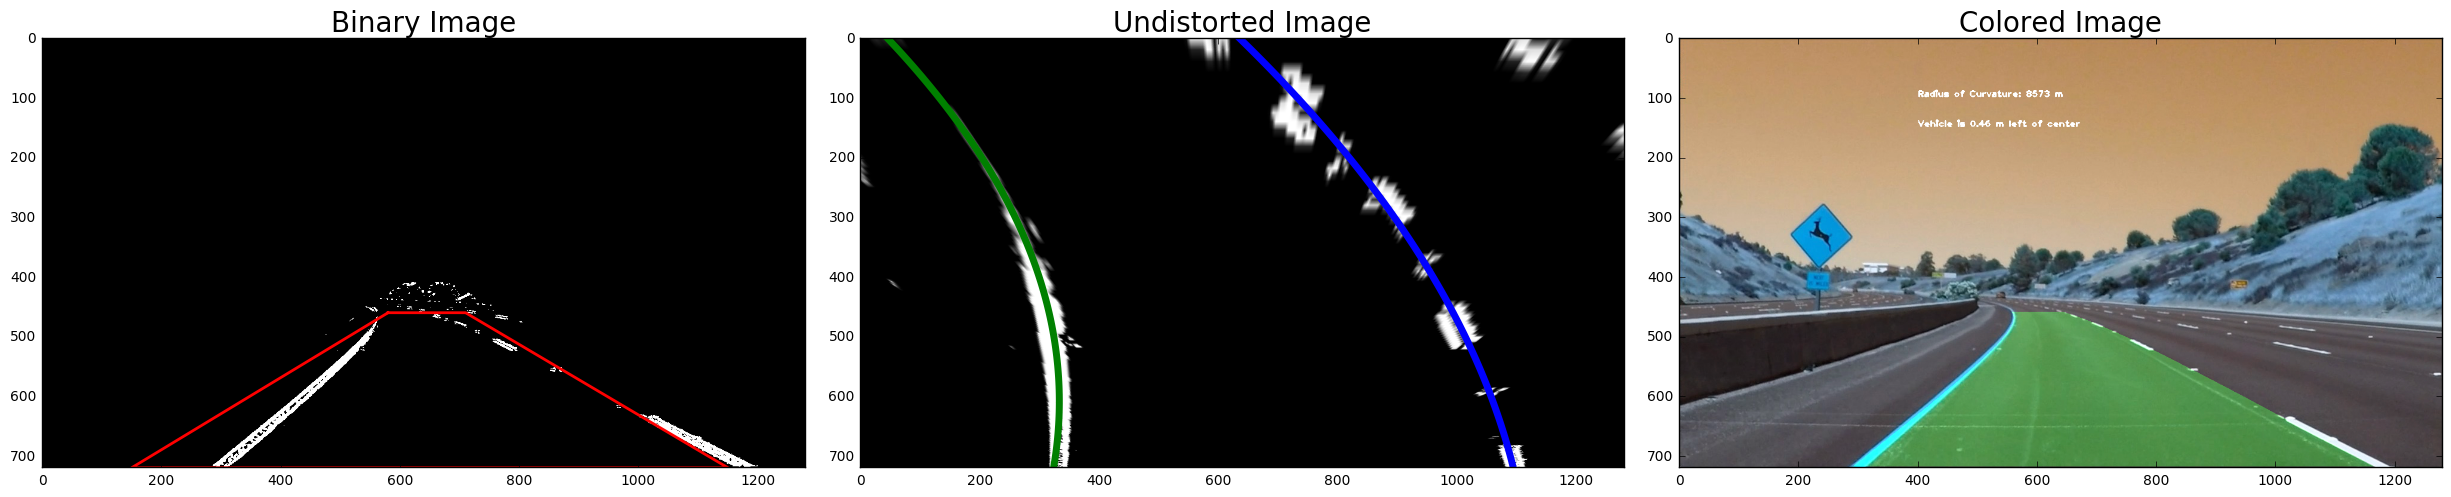
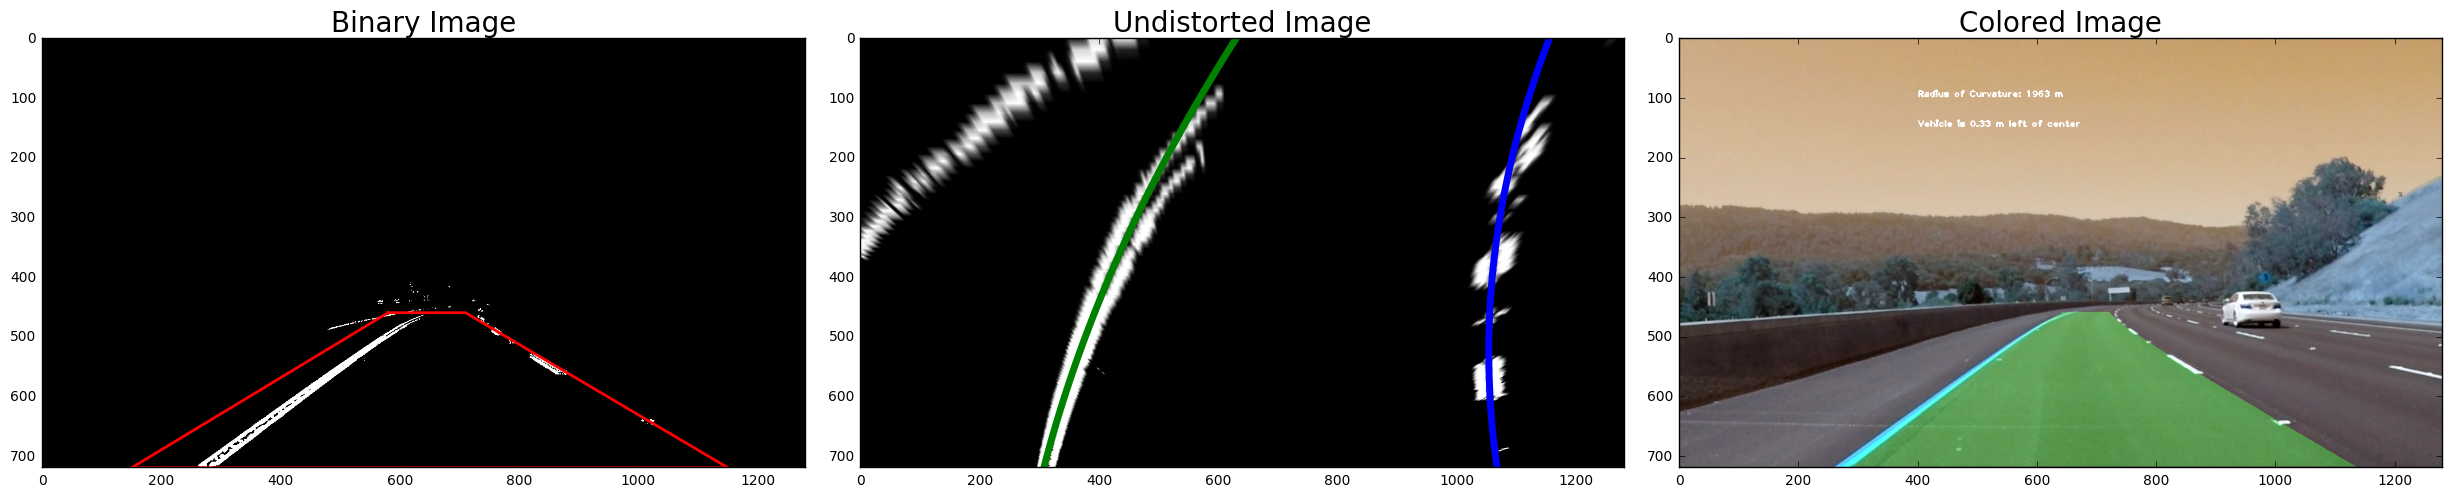
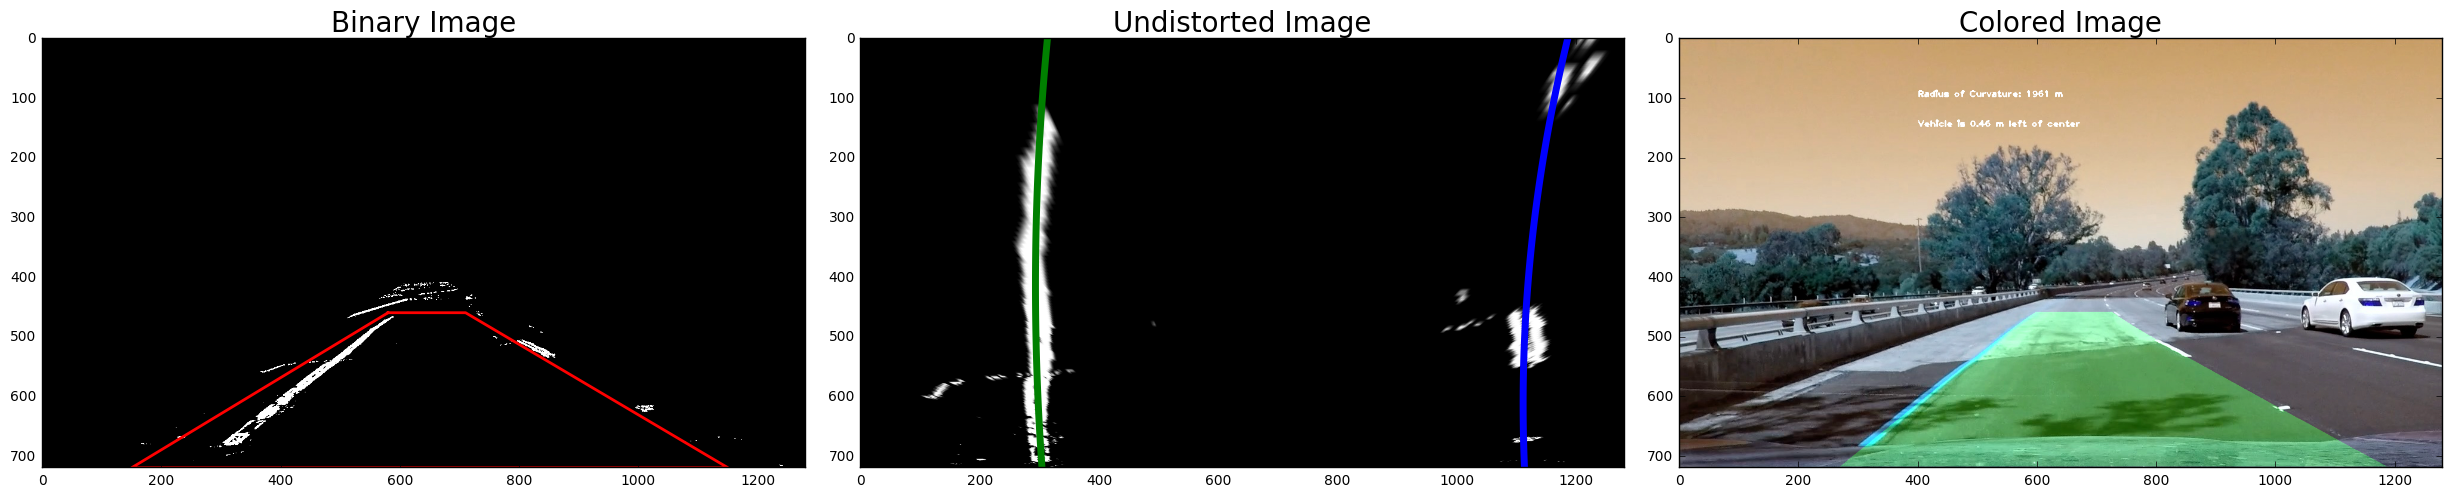
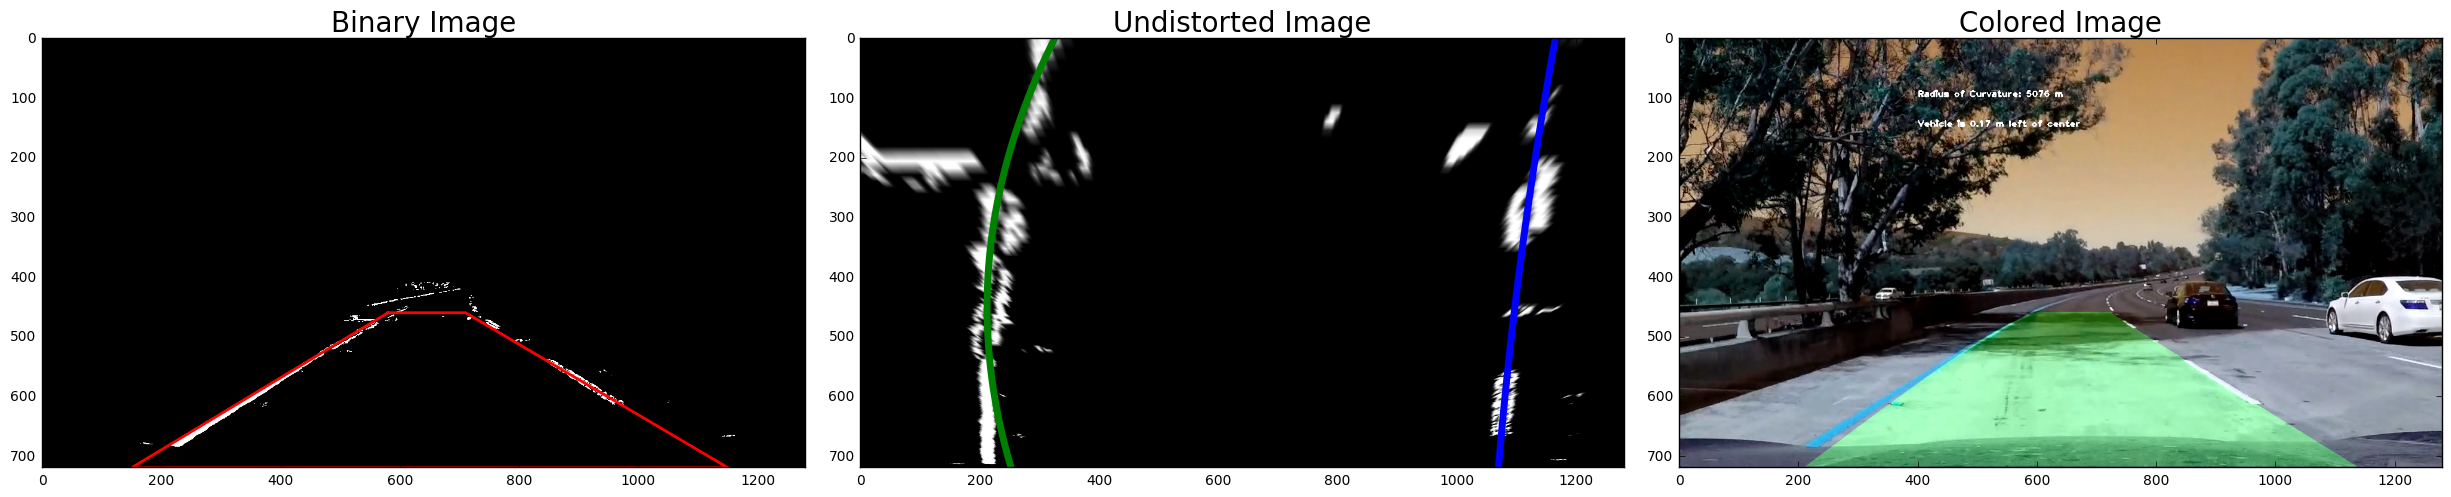
ax1.set_title('Binary Image', fontsize=20)
ax1.plot(x_values,y_values,'r-',lw=2)
ax1.imshow(img, cmap='gray')
# Find lanes
a, b, c, _, _, _, _, _ = fit_lanes(birds_eye)
ax2.plot(b, a, color='green', linewidth=5)
ax2.plot(c, a, color='blue', linewidth=5)
ax2.imshow(birds_eye, cmap='gray')
ax2.set_title('Undistorted Image', fontsize=20)
# Set up lines for left and right
left_lane = Line()
right_lane = Line()
# Color lanes
image_color = process_image(img_raw)
ax3.imshow(image_color)
ax3.set_title('Colored Image', fontsize=20)
# Adjust subplots
plt.subplots_adjust(left=0., right=1, top=0.9, bottom=0.)
Show in Video
### Import everything needed to edit/save/watch video clips
from moviepy.editor import VideoFileClip
from IPython.display import HTML
# Set up lines for left and right
left_lane = Line()
right_lane = Line()
white_output = 'output.mp4'
clip1 = VideoFileClip("project_video.mp4")
white_clip = clip1.fl_image(process_image) #NOTE: this function expects color images!!
%time white_clip.write_videofile(white_output, audio=False)
[MoviePy] >>>> Building video output.mp4
[MoviePy] Writing video output.mp4


100%|█████████▉| 1260/1261 [06:33<00:00,  3.18it/s]


[MoviePy] Done.
[MoviePy] >>>> Video ready: output.mp4

CPU times: user 6min 41s, sys: 1min 15s, total: 7min 56s
Wall time: 6min 34s